Description
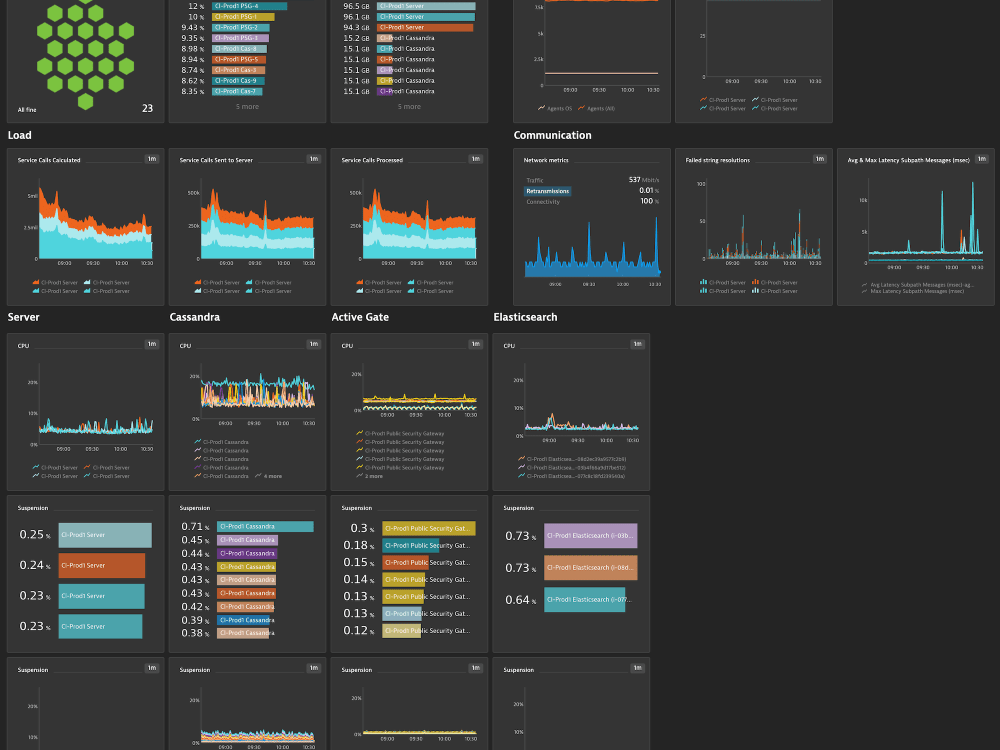
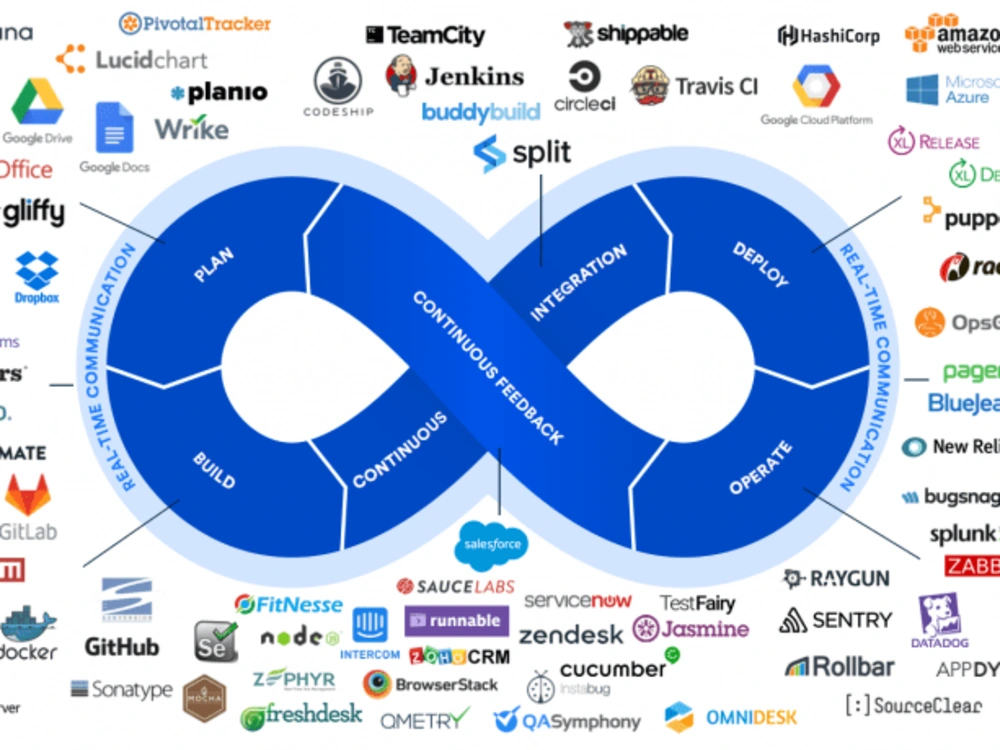
Monitoring & Logging Tools are essential for maintaining application health and ensuring system reliability in modern IT environments. Monitoring tools collect real-time metrics (CPU usage, latency, uptime), while logging solutions capture detailed event data across distributed systems. These tools often include alerting mechanisms, visualization dashboards, and anomaly detection features. By centralizing logs and metrics, they simplify debugging, accelerate incident response, and support compliance audits. Popular stacks include ELK (Elasticsearch, Logstash, Kibana), Prometheus + Grafana, and commercial platforms like New Relic and Datadog. These tools integrate into DevOps workflows, support custom dashboards and alerts, and enable predictive analytics. Effective monitoring and logging enable proactive operations management, improve user experience, and minimize costly outages.
Dada –
The Monitoring & Logging Tools service offers a solid suite of features for tracking system performance and identifying potential issues. The interface is intuitive, and the reporting capabilities provide valuable insights. A worthwhile option for businesses looking to enhance their IT infrastructure visibility and proactively address problems.
Izuchukwu –
This site offers a solid selection of monitoring and logging tools. The range is comprehensive, catering to diverse IT needs. Documentation is clear and helpful, and the comparison features made choosing the right solution easier. Overall, a worthwhile resource for streamlining your system management.
Rasaq –
The Monitoring & Logging Tools provided on this website offer a comprehensive suite for observing system performance. The dashboards are clear and customizable, and the alerting features are effective. While initial setup can be complex, the detailed documentation assists users in navigating the process. Overall, a valuable resource for proactive IT management.